
“History doesn’t repeat itself, but it does rhyme”, Mark Twain is alleged to have said and, reflecting on the history of financial markets and economics, it is hard to argue with the sentiment.
Indeed it is to be hoped the previous post has demolished the notion that an unthinking allocation to “bonds” will automatically make an investment portfolio safer, when all it takes is brief delve into history to show this can be far from the truth.
But the world is a different place today, begging the question of whether or not the rhyme will be of the gentle nursery school variety, or a rather more in-your-face bout of Stormzy style grime?
In reality we will show below it could be very much a Grimm affair.
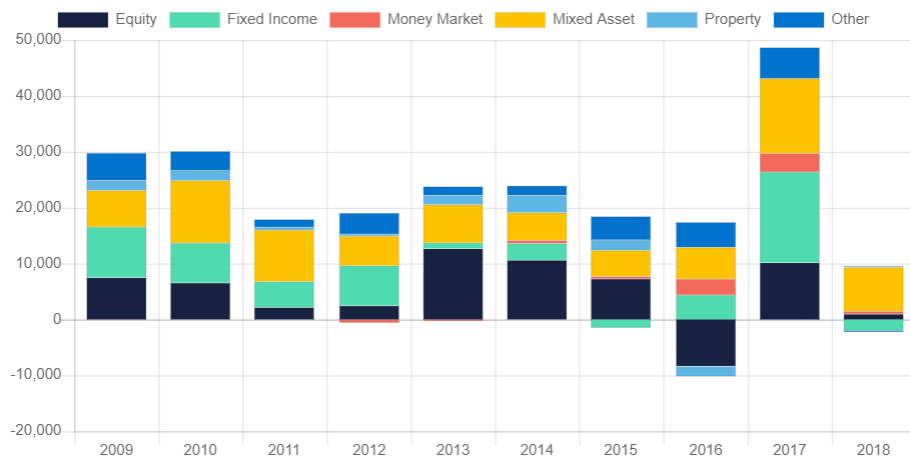
First we should establish if it really is such a big deal for UK investors, which takes us to the fund sales figures from the UK’s Investment Management Institute (IMA) whose excellent interactive database can easily be found HERE. To save you time however below is a chart showing the UK sales of different retail fund asset classes over the last decade.
Click/Tap to Enlarge
Now you can see that the Green Fixed Interest element has, over the years, garnered somewhat greater flows than the Equity space, while often running close to the Mixed Asset class, which adds a further twist to the story. One might think Mixed Assets would be adding a useful degree of diversification, however in truth most funds in this space are essentially and equity/bond blend, with a bit of property thrown in.
Thus, it is safe to assume around 30%-40% of the Mixed Asset space will effectively be in the same universe. This is a lot of money in corporate bonds. What could go wrong?
Liquidity
The ability for investors to exit their positions as and when they want has recently become a serious issue for many, as just a couple of years since a number of property funds temporarily “gated” (shut the door to deals), we have recently seen the former “superstar” fund manager, Neil Woodford do the same with his Income fund. This was sold as a mainstream equity fund, but over the years, through a variety of causes, it has become increasingly illiquid, to the point where the fund would have been unable to meet redemptions without a fire sale of assets.
Thus, the fund is “gated” (or shuttered) to allow the manager time to dispose of assets at a sensible price.
At the heart of the problem is a “liquidity mismatch”, when a fund that trades on a daily basis holds assets that may take weeks or months to dispose of, as is clearly the case with commercial property. After all if you own 50% of a City office block you can’t sell it this afternoon just because a lot of investors get panicky. Yet lots of funds are so exposed to this problem, to the extent it could be so systemic it was raised in part of Mark Carney’s astonishing New World Order speech, covered very shortly.
But surely, as bonds are the biggest market in the world, liquidity can’t be an issue?
Sadly it is, as we can see by reprising this chart from JP Morgan, we first used back in 2015 (we don’t have current one, JPM tend to drop charts out of their packs as the get too negative!), showing how dealer inventories (liquidity) has dropped as the number of bonds in issue has grown (the figures are US but the story applies to the UK and EU, as we’ll show later):

Click/Tap to Enlarge
Basically, dealers have as smaller and smaller pool of funds to absorb stocks, in large part because post GFC regulations severely restricted the ability of banks to trade on their own account.
You might ask; how can this work, when there has been such obvious demand for bonds, globally. Who has been making the market?
Put simply there hasn’t been a need for a two-way market with an overwhelming weight of buyers matched to willing sellers/issuers, as companies have geared up their balance sheets in unprecedented fashion as the level of Corporate Debt to GDP soars:

Click/Tap to Enlarge
To a degree this makes sense as debt servicing costs fall as interest rates so, however it is worth remembering that this is usually long-term debt, that will be constantly rolled over (and thus becomes very-long-term debt) and as we showed with mortgages (HERE) the idea that low interest debt is cheap over a long-term is a basic, dangerous and undeniable fallacy.
The Investment Grade Issue
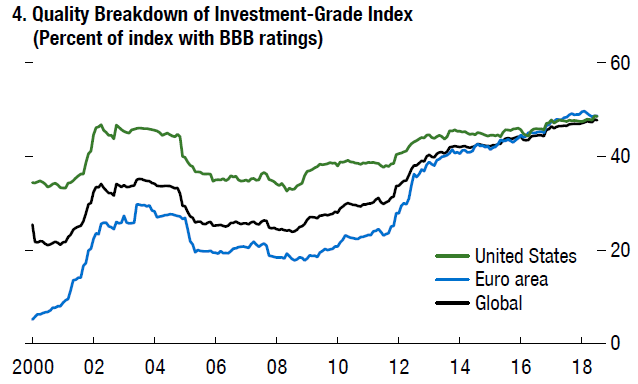
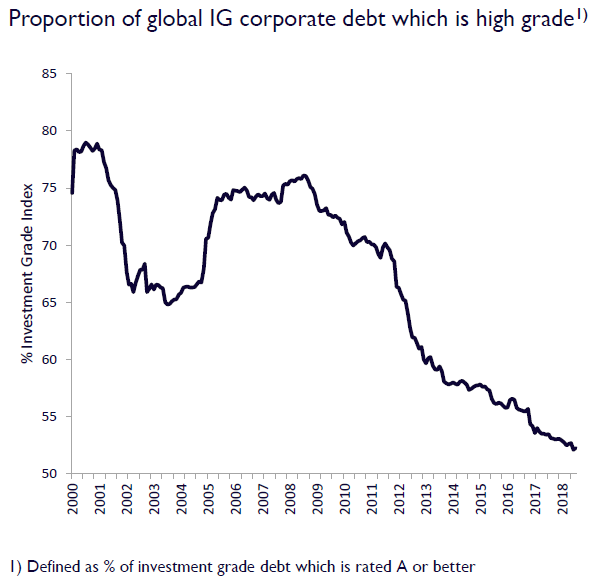
More importantly the quality of the key “Investment Grade” debt, which runs from AAA, AA, A to BBB, is falling with more and more now being rated as the lowest permissible grade of BBB.

Click/Tap to Enlarge
Indeed if we look at a breakdown of the Investment Grade universe the deterioration in quality is clear:
Click/Tap to Enlarge
And this is a global issue:
Click/Tap to Enlarge
While the amount of A and above is falling:
Click/Tap to Enlarge
Even more troubling is that the amount of debt on the balance sheet of BBB companies is roughly twice its historic norm. indicating that many of these companies could slump to BB or worse very quickly, which would be bad. Very Bad!
The BB liquidity nightmare
Why should this simple removal of a single B be so bad? Well in part because, as we will show below it means a higher yield and a falling price.
However we cannot move on without pointing out that many institutional investors are limited to holding BBB grade bonds and higher. Thus if there are a large number of bonds that fall in rating there could be the need to sell literally billions of bonds that are falling in price, causing a liquidity mismatch and thus potentially a serious crash, which could spread across markets.
Worse in the US there are a number of old world, low growth, behemoth’s who are struggling to retain their BBB status, and it might take only one downgrade to set of seriously damaging ripples.
(This is a problem when one of those companies, GE, is accused of fraud on a massive scale. If this proves even half right and a downgrade is forced through by the ratings agencies then the basic pricing risks we discuss below could seem rather insignificant by comparison.)
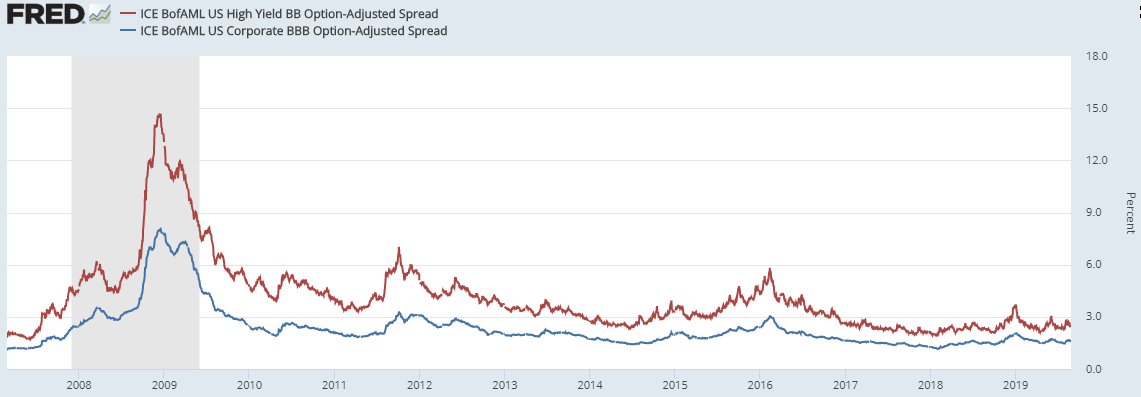
You see BB debt is no longer investment grade, it is instead High Yield, perhaps even on its way to “Junk” status and thus requires a higher yield and necessarily a lower price, creating a wider spread (the “risk/yield spread” against government debt, required by investors to justify holding riskier assets) which we can show in this chart of the credit spreads of both BBB and BB debt over time:
Click/Tap to Enlarge
You can clearly see how the “spread” on BB bonds is always above that of the BBB universe, particularly during times of stress, such as during the GFC and it is this blow-out in the spread that explains why higher yielding funds can fall dramatically, even as government rates are cut.
Yet at the end of this chart the spread is only 0.85%, not much more than it was at the lows of 2007, when it reached just 0.55%, before expanding wildly.
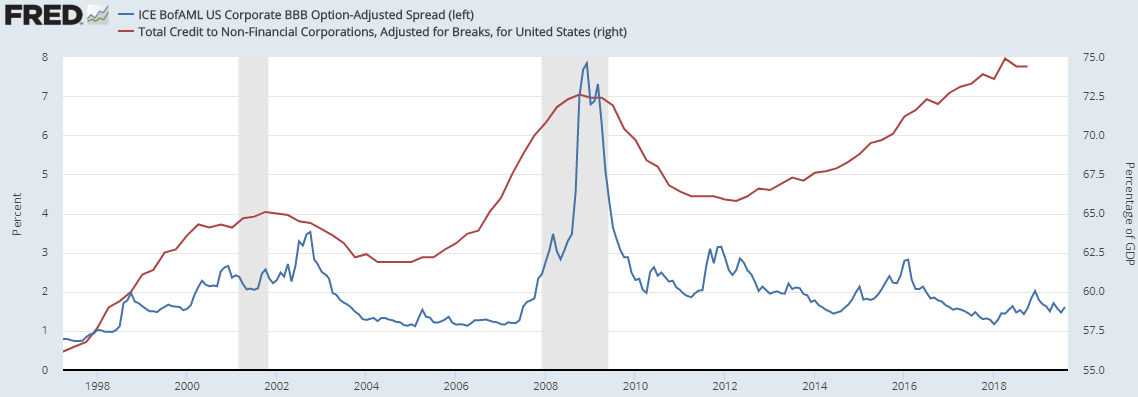
Yet this is against a background of massively growing debt as this chart comparing the BBB spread, with the amount of corporate debt demonstrates:
Click/Tap to Enlarge
Yet the US is not the worst offender in this debt build up, as we can see if we add the rather alarming Eurozone line to the chart (a brief examination of EZ debt figures shows France’s stock of private sector debt has, almost unnoticed, ballooned alarmingly in recent years):

Click/Tap to Enlarge
In a market facing a collapse in liquidity, the risk of significant downgrade shocks, slowing growth, and Central Banks limited in their ability to respond to see such high prices/low spreads on an asset class that has expanded massively, representing a cyclical downgrade in corporate creditworthiness is, well, bonkers.
In nearly three decades working in some of the bubbliest markets in history, in a world where debt has exploded (and the understanding of debt mathematics has collapsed) this is perhaps the most extreme, most dangerous and most misunderstood one of them.
It is to be hoped it doesn’t burst………Oh did we mention Leveraged Loans?
No. OK. So it gets a bit worse but this is enough doom and gloom for one day