
In a time-poor world even basic analysis and commentary can get in the way of a message, while deliberate irony, sarcasm (no matter how well deserved) or hyperbole can lead the reader astray.
Hence when making statements about the Everything Bubble and Peak Insanity it is probably best to, at least occasionally, make sure the audience understands clearly the very real background to those statements.
Thus is born “Pure Facts” posts, which will provide lots of clear graphical evidence, starting with Central Banks and their money printing.
Central Banks & Quantitative Easing
(QE, or: Money Printing into Financial Markets)
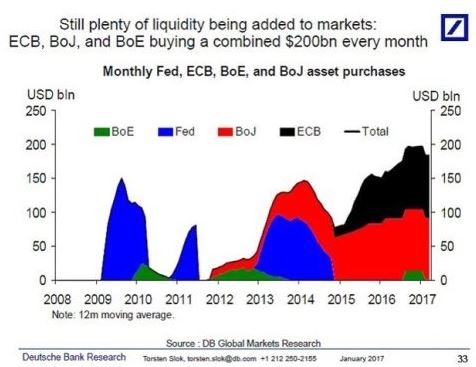
QE was born in the depths of the Global (Great) Financial Crisis (GFC) as Central Banks sought to restart the broken world economy and at its peak in 2009 the US Federal Reserve was briefly injecting $150bn a month to buoy up the financial system.
Now with the global recovery picking up speed there can’t be anything to match that…..surely?
Source: ZeroHedge Click/Tap to Enlarge
In fact while the US Fed stopped with QE3 in late 2015 the baton has been well and truly passed on with 2016 seeing QE reach $200bn a month and so far, over 20 months, QE has been roughly 3 times the level of 2009.
QE works by Central Banks printing money out of thin air to buy assets, mostly government or high grade bonds, but increasingly also shares.
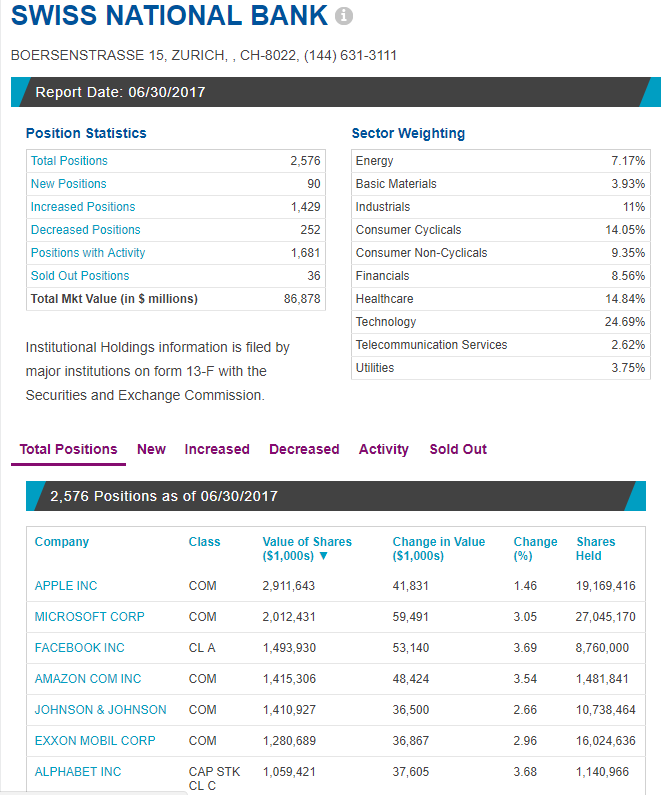
Thus their balance sheets swell as they hold more and more real assets, effectively bought with conjured air and this is what the SNBs (first) asset page looks like on the NASDAQ website:
Source: NASDAQ Click/Tap to Enlarge
At the 30th June 2017 the SNB held $86bn in US Equities. If you look down the full portfolio it is effectively a US S&P 500 Tracker fund, less the banks and financials, which if held could cause a bit (more) of a conflict of interest.
WHY?
Very quickly: The SNB prints Swiss Franc and trades them for dollars. With more Francs around this should lower the price of the Franc, while reducing dollar supply should strengthen that currency. Thus the core purpose is trying to keep the Swiss Franc weak.
What to do with those dollars. Buy US equities, which in turn pushes up US Markets, hopefully encouraging more dollar investors.
In the meantime the SNB earns lots of dollar income and posts trading profits – all from money that is merely conjured air.
But the SNB is small fry. Let’s look at the G3 (US Fed, European Central Bank – ECB – Bank of Japan – BoJ) Central Banks balance sheets:

Source: ZeroHedge Click/Tap to Enlarge
Now adding $10tn of assets is pretty impressive, but does that really impact markets?
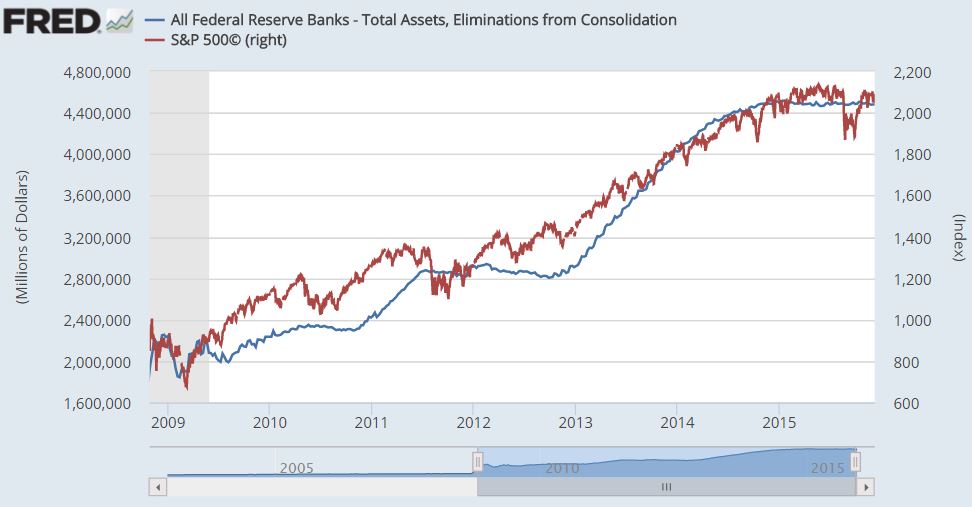
Well let’s start with the old US Fed QE and S&P Chart we’ve shown many times before:
Source: St Louis Fed/AG Click/Tap to Enlarge
The correlation between the S&P and QE is closer than any other, particularity “real” corporate revenue growth.
You may also observe that in mid 2015 the market wobbles against a background of no more QE in the US. Scroll up to the first chart you may see the impact of the ECB and BoJ picking up the slack.
This is reflected on the next chart.
Source: ZeroHedge Click/Tap to Enlarge
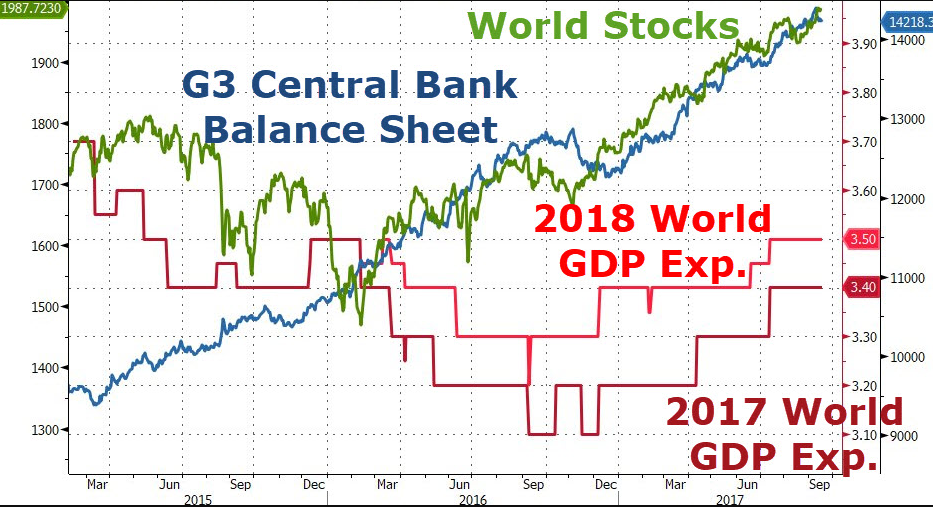
The chart above actually reflects the ECB and BoJ impact on G3 Balance Sheets, as the Fed had stopped printing, and their actions appear verysupportive, helping markets recover early in 2016, following the key G20 currency accord (discussed in detail HERE in the very likely event you’ve never heard of this crucial agreement).
Note however this joyous global GDP growth, that we’ve heard so much about ends the chart lower than it starts, unlike the market….and it isn’t just stock markets but other closely correlated risk markets.

Source: ZeroHedge Click/Tap to Enlarge
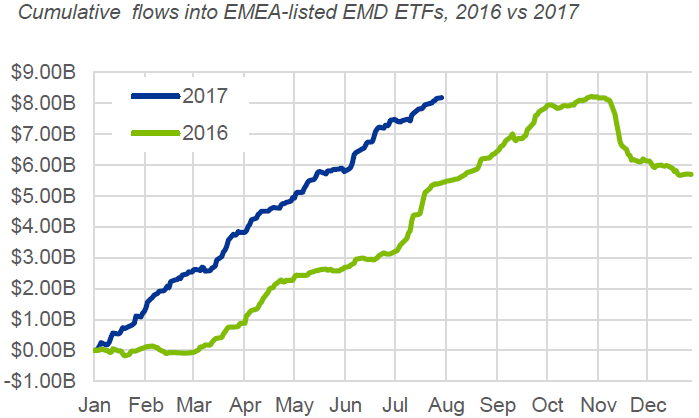
Certainly following the wobbles around the election of the Donald, or the Orange Swan as he is increasingly known, the return on Emerging Market Debt (EMD) correlates closely with money printing (which is designed in part to push investors to take more risk), reflecting in hot money ETF (Exchange Traded Fund) flows (basically dollars seeking better returns elsewhere):
Source: BlackRock Click/Tap to Enlarge
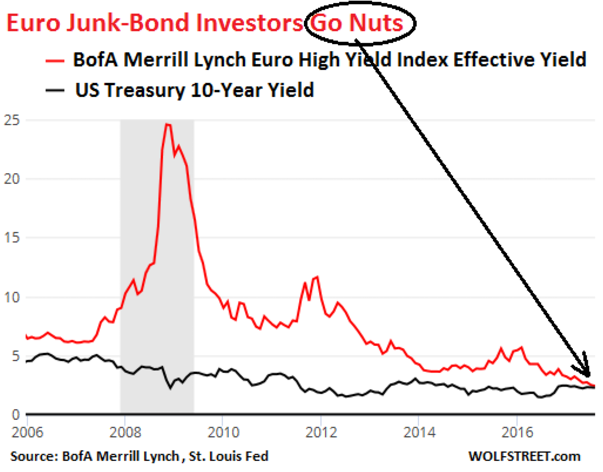
Now these could be merely correlation rather than causation but some mighty odd pricing is going on with assets, like European Junk bonds yielding the same as US Government Bonds:
Source: Wolf Richter Click/Tap to Enlarge
This would indicate that the market thought low grade debt from poorly performing European companies was no riskier than the debt of the world’s largest economy with its ability to print the worlds banking currency at will.
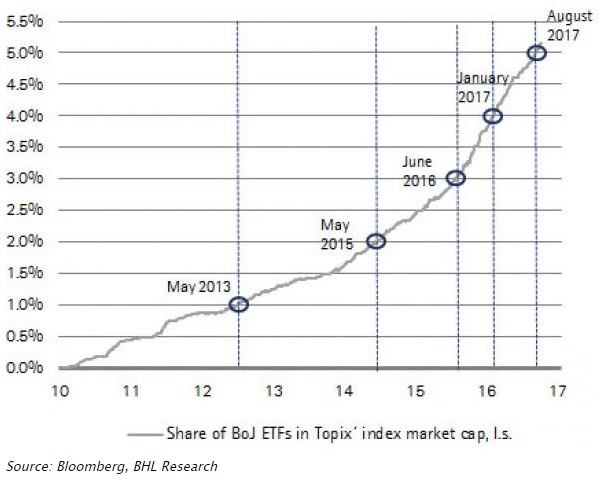
Frankly QE has now reached such levels that the Central Banks are running out of government bonds to buy, with the ECB struggling with German debt, while in Japan the BoJ now owns several percent of the Stock Market:
Source: Bloomberg Click/Tap to Enlarge
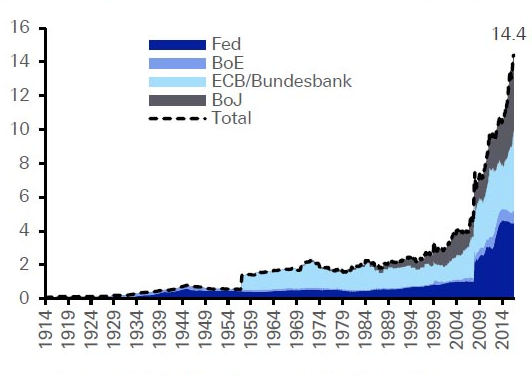
But this isn’t the first big global crisis, so has this happened before?
Source: Deutsche Bank Click/Tap to Enlarge
The chart above showing Central Bank balance sheets historically would suggest not!
How this ends nobody knows and frankly even with the US Fed’s Chair, Janet Yellen, talking of normalising their balance sheet we can’t see it happening for a very long time, however at what point do they stop trying to nationalise capital markets?
That is a question of opinion, not Pure Facts, so for the moment we will just say, be aware that this is going on and wonder why it’s necessary if everything is right with the world.