
Stock Markets are expensive, particularly the US, which, whether we like it or not tends to drive global trends. Furthermore it is the US market that receives the greatest coverage, particularly on financial TV, where you will see cohorts of talking heads singing it’s praises, whatever occurs, to the point where you may conclude that all news is good news for the stock market.
However is there any value in the market and is the enthusiasm justified or delusional?
Answering that would be opinion, so let’s look quickly at the facts via a few charts (charts on Investor Bullishness follow in the next post)
US Stock Market Valuation Extremes
One of our favourite and most comprehensive analysis of US Stock values is provided by Doug Short’s Advisor Perspectives ( excellent website, which cover most key US data in detail HERE)

Source: Advisor Perspectives Click/Tap to Enlarge
The Green and Red lines represent the two different versions of the Price Earnings Ratio (PER – Or Share Price divided by Earnings Per Share, or EPS) on an 10 year adjusted average basis, while the Q Ratio (Blue) is the replacement value of the companies within the index. The Black Line is the long term average value of the market. (More details can be found HERE)
So Price to Earnings (EPS) is high, so shares are expensive, but adding a (factual) nuance makes the picture worse:
Source: Real Investment Advice Click/Tap to Enlarge
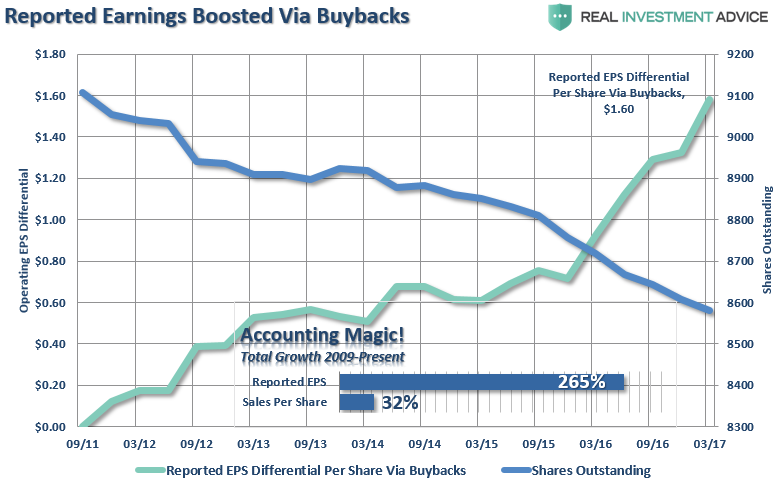
This chart, from Houston based Real Investment Advice’s Lance Roberts shows the impact of rising EPS, the upward sloping line, as the number of shares in circulation falls (downward sloping line) as companies have bought back their own stock (at ever higher valuations) using cheap debt (so loading up their balance sheets with debt -see below -which isn’t being spent on new plant or staff) to goose their earnings, so goosing their share price, and so inevitably executive bonuses (all facts).
(At this point you might ask:
“Shouldn’t the market punish companies that are loading up on debt, weighing down their balance sheet and adding risk, just to superficially manipulate earnings without increasing sales, rather than invest in their businesses future, their marketing, their exports, their innovation, their plant, staff and IT, and thus their shareholders and stakeholders future? Shouldn’t that happen in a rational markets??”
That would be a very rational question but whether the market should reward investment for real long-term economic growth or short term crowd pleasing in a debt ponzi economy….well that’s an opinion so we will pass for the moment.)
At the bottom of the above chart we see the impact of this manipulation as reported EPS since 2009 has increased by 265%, yet top line sales by only 32%.
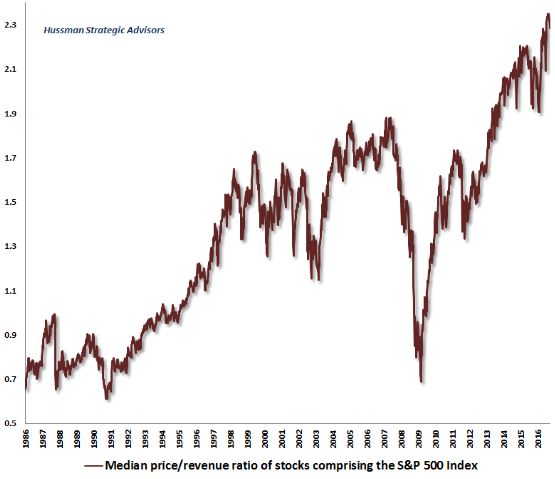
Probably worth looking at how share prices have done compared to top-line revenues/sales then:
Source: Hussman funds Click/Tap to Enlarge
This chart form the always deeply analytical Dr John Hussman (website HERE), who currently believes that shares are at “the single most overvalued point in the history of the US stock market”, shows just how expensive shares are relative to sales, not only against 2007, but also 1999/2000 and 1987.
Back at the top of the Tech Boom in 1999/2000 however there was a dispersion of valuations, with the top 10% (Tech in this case) very high and some old fashioned industries very cheap on a historic basis.
However by breaking down each decile (10%ile) of valuations Dr Hussman shows how stocks are historically pricey across the board despite a large dispersion between the most expensive (largely Tech again…and remember this isn’t stock market level, this is absolute value against sales) and the cheapest:

Source: Hussman funds Click/Tap to Enlarge
You can see how the most expensive stocks were more expensive in 2000, but only that 10%, every other decile is at new highs.
You may recall a couple of charts ago we metioned how share buybacks were distorting bottom line earnings (EPS), hence why price to sales can be a better reflection of real business valuation.
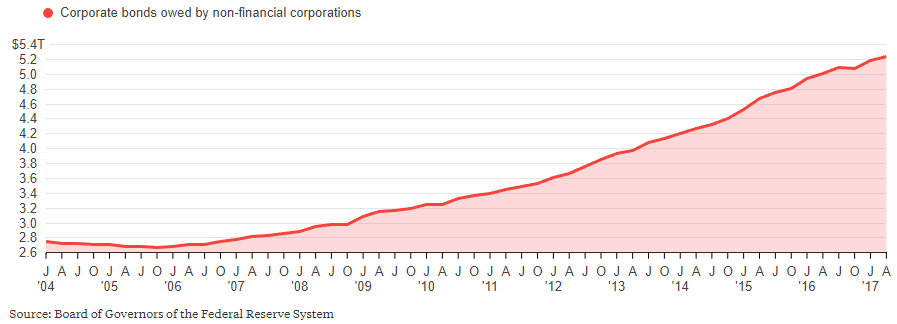
We also mentioned that companies had been borrowing money to buy shares, swapping debt for equity, reflecting a significant debt build up, reflected in this chart showing how the debt keeps building and building:
Source: US Fed Click/Tap to Enlarge
So we can see EPS (Earnings Per Share) has been manipulated by debt fueled buybacks (and there is a whole other post to come on the fiction of widely quoted of Forward EPS reporting) which still leave stocks looking very expensive, while against top-line, real, earnings they are literally off the old charts.
For thoroughness lets look at a a couple of other measures, the first being the value of the S&P against its Gross Value Added, or the economic output of all the shares in the index:

Source: Felder Report Click/Tap to Enlarge
This chart, from the excellent Felder Report (specific report HERE) makes a pretty strong case but I particularly like the comparison of the value of the market to GDP divided by GDP growth rate.
The first part of this, the value of US stocks to the output of the US economy, is said to be Warren Buffet’s favourite valuation metric, which like Tobin’s Q on the first chart of this post is a very different way of measuring value.
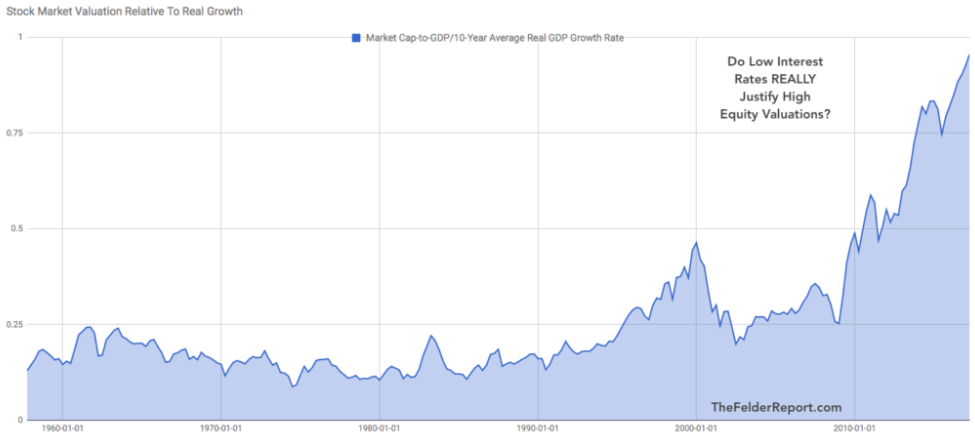
However by dividing this by the expected growth rate, based upon the recent past, takes on one of the key Bull arguments that high valuations are justified is because interest rates are so low.
Now this is an opinion (which can be rapidly shredded on many logical fronts) but if we simply assume that these low interest rates are possible only because of low growth rates (it’s an opinion to a degree but the only one that actually justifies the super low interest rates existing at all) we can compare the value of the market divided by expected GDP growth to enable us to judge whether it is over or undervalued compared to the real economy:
Source: Felder Report Click/Tap to Enlarge
Of course there is a degree of opinion here in the choice of method, but the underlying message is undeniable.
This is a very expensive market.
Finally a nice simple chart showing the evolution of the S&P vs US economic growth:
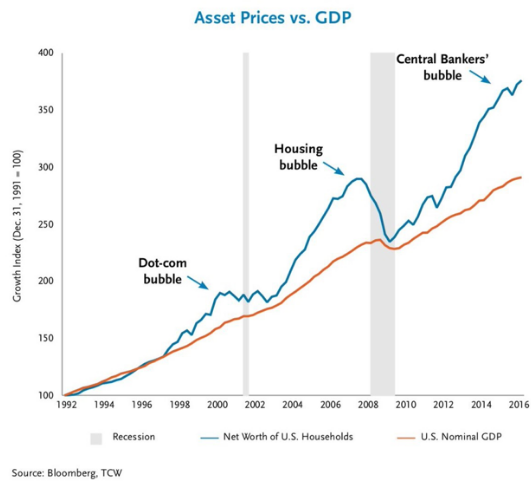
Source: Bloomberg Click/Tap to Enlarge
In the next post we detail that despite these facts there is undeniably also Extreme Investor Bullishness