
Bitcoin has finally done it, pulled Bubble economics into the harsh light of day to be almost unmissable to anyone with an attention span although it is probably the least important of all the current problems we face, at least for the moment.
Over the coming days and weeks Prometheus will explore in more detail some of the more troubling and often barely known aspects of asset markets and the global economy in general, from Minsky to Mathematical fallacies. We will also present a number of pieces on the underlying psychology and narratives of the plethora of bubbles we face in the MOAB (Mother Of All Bubbles) era.
We begin with a quick initial examination of Volatility, or more specifically the VIX Index and the entirely (terrifying) investment universe that has evolved directly and indirectly out of what was initially simply an index created to reflect what the derivatives market anticipated future stock market volatility to be.
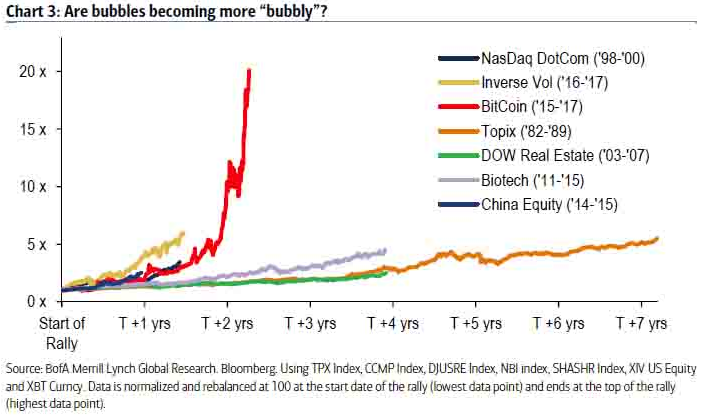
Now worrying about a bubble in an asset few have heard of (which is itself as an index and as such a rather existential “asset”), let alone a bubble in shorting (a financial activity most people know little or nothing about) said existential asset sounds bizarre, but let us first set the scene reprising a chart from one of the first Pure Facts posts a couple of months ago highlighting some of the current bubbles, which puts the “Inverse VIX” (another way of describing a VIX Shorting as a strategy) as a second to Bitcoin (since when the Bitcoin bubble has gone exponential, but more later as it is much less systemically dangerous than the VIX):
Source: ZeroHedge Click/Tap to enlarge
You can see that this chart shows a return that makes even epically overvalued stock markets look rather shy by comparison, yet how has this occurred? Now this post is not about delving into the details, just key facts, however a larger introduction to the VIX and some of its growing problems was first posted more than three years ago (HERE) for those interested but for the moment let’s simply look at a few basic points.
The VIX is an index measure of volatility in the US stock market and historically averages in the mid-teens (the reason for this can be found following the link above and will be covered in detailed later posts) and tends to move up as markets become less certain and fall as they become more comfortable/complacent. Hence the VIX has become known, rather incorrectly, as the “Fear Index”.
This relationship is shown clearly in the following chart, which also highlights how of late the VIX (in black) has become quiescent, even as uncertainty has grown (in Blue):

Source: ZeroHedge Click/Tap to enlarge
This stillness and disconnect from the normal causes of volatility is strikingly demonstrated by a chart from a couple of weeks ago which demonstrated how the VIX had closed below 10 for a longer period than in its entire history despite the uncertainty measured above.
Why this is occurring is a matter of opinion and analysis, which was covered in the post linked to above and will be explored in greater detail shortly. But we can briefly explain why speculators short the VIX by showing the VIX Curve, or “Term Structure” below (which interestingly was taken last week when the VIX briefly lifted above 10):

Source: VIXCentral Click/Tap to enlarge
The dashed line at the bottom is the VIX Index current, or “Spot”, price while the Curve represents the price of “VIX Futures” (the dots representing each monthly contract) which as you can see are more expensive the further they are from their redemption date. This is a normal “futures” curve, where exposure to the price in several months time is more expensive due to its “time value”, which itself reflects uncertainty and ironically volatility.
Thus think of the dots, representing each monthly price, flowing to the left towards redemption, as if the they were coins on the surface of a treadmill which is represented by the line of the graph, before they reach down towards the “Spot” and disappear off the treadmill as time moves on and new dates arrive from the right. Thus as each month goes by if the VIX doesn’t spike upwards the investor loses more and more as a % of their stake until over the last month you can lose 10%-15% in a month.
If however you “Short” the VIX, selling, rather than buying exposure to the descending curve, to buy back your position at the lower redemption price this 10%-15% monthly loss can become a monthly gain.
I repeat shorting the VIX can create a 10%-15% monthly gain!
Hence you can see the attraction and the resulting massive “Short” interest in the product:

Source: The Felder Report Click/Tap to enlarge
Frankly the real exposure to this policy is far beyond this chart, taking in as it has an increasing number of strategies, leaving some to estimate direct US exposure to “Short” or “Inverse” Volatility being between $1.5tn – $2tn (yes that’s Trillion) and that’s before we look at how volatility measurements impact portfolios and markets globally …..then the numbers get disturbingly large)
However what happens if the VIX suddenly become volatile (if the stock market falls sharply for instance), what might happen to these mass of shorts. Well let’s look at the Curve from October 2008, shortly after Lehman’s and, although an extreme, it is instructive:

Source: VIXCentral Click/Tap to enlarge
In a repeat of this stress event if you find yourself “Short” the VIX at 10, you may have to buy it back at 60, swapping a 15% gain for a 500% loss. Thus this trade has long been considered by risk aware professionals as akin to picking up pennies in front of a steam-roller, although to be fair it has of late proved to be picking up dollars in front of a rather steam free roller……so far.
In reality as there is so much staked on volatility remaining quiescent the potential losses of a VIX spike, and the reflexive relationship to markets reversing, are probably incalculable and, more importantly, would undoubtedly lead to a global market panic if realised.
It is worth noting though how the short interest highlighted a couple of charts ago picked up as Central Banks – CBs – have progressively increased their intervention in markets with QE3 in particular beginning in 2012 and then the ECB and BoJ going gangbusters in 2016:

Source: ZeroHedge Click/Tap to enlarge
This naturally suppressed volatility, as detailed in the following BoA Merrill Lynch chart showing how the CBs have successively intervened so much we reach the point where their intervention is no longer needed publicly:

Source: ZeroHedge Click/Tap to enlarge
More to the point, and as we explored a few years ago and will explore again, such is the weight of money within volatility linked strategies it seem probable they have themselves been responsible for helping suppress volatility within the markets, creating the classic “Reflexive Relationship” that Hedge Fund guru George Soros wrote about in the 1980’s in his book “The Alchemy of Money”. This is the same man who famously bet against the pound in 1992, leading to the UK leaving the ERM on White Wednesday, also making the odd billion in the process (back when a billion was a lot of money).
As a point of opinion the fear is that such a tight volatility suppressing mechanism has developed, building and propagating unappreciated co-dependant leverage in the system, that a serious shock could destabilise markets in a catastrophic fashion, creating the feared cascading crash.
Will this happen? Who knows and it may be possible that if the current low vol’ regime continues the VIX curve itself could flatten as the expectation of future volatility collapses (and thus the “time value” falls as there is less uncertainty), naaturally reducing the steepness of the curve to such a point where there is little profit and only risk to be gained from shorting the VIX. This itself would gently kill the money making opportunity and remove the risk.
Such is the current distortion of market capitalism that such an outcome cannot be ruled out, although it seems improbable.
In the meantime while the arcane VIX Short bubble receives little attention (making it a natural Black Swan to the larger world, a fact us financial geeks sometimes forget) the Bitcoin Bubble is in full flow.
Now while the real value of Bitcoin is a matter of opinion in our office Block Chain currency technology has been of interest for some time as we think it may be a key part of the changing, post Bretton Woods/Gold Standard, global currency dynamic. We see this as the power of the Eurodollar in particular remains a worry within the international banking system, while the use of SWIFT as the global money clearing system has undoubtedly been abused by the US.
Furthermore as we know a Professor of Mathematics who is involved in high level research to help the technology mature and become “Real”, we can safely and factually say this tech is not new to us and all the evidence points to the current Bitcoin Bubble being just that.
Perhaps though the MOAB, having inflated almost everything to extremes (fact not opinion, see Pure Facts HERE) with Bitcoin it may have found its own popular apotheosis.
Frankly Bitcoin is now becoming almost hilarious, with the following chart, taken last week as the details for this post were collated, stunning us at first glance as it looked like an annual chart, yet it was for just 24 hours:

Source: Coindesk Click/Tap to enlarge
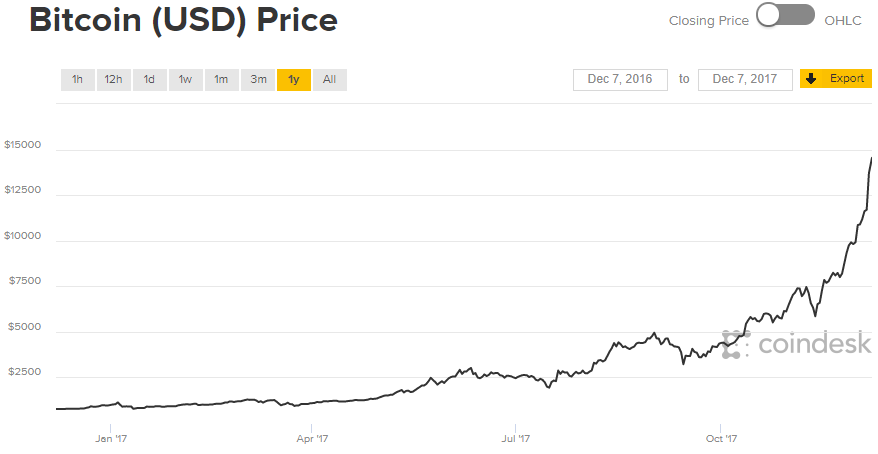
While the annual chart looks, well Tuilipy!
Source: Coindesk Click/Tap to enlarge
In fact we have just read that Bitcoin has now managed to exceed the seventeenth century excess of Tuilipomania, itself the biggest bubble in recorded history, against which the S&P looks…..well invisible:

Source: ZeroHedge Click/Tap to enlarge
For the reader uninitiated in the events listed above (and after we have tackled some of the current excess) we will take a look back at some of these other historic episodes in our exploration of bubble psychology as they inform us very clearly that people have changed very little over the centuries, unlike the technology that surrounds them.
Unless of course cascading events overtake us and then we will leave the discussions on history until after the ashes have cooled a little.