
As the US Corporate results season draws to a close it appears to have lifted spirits nicely. Indeed after the sharp market falls in February linked to the Volatility spike and the accompanying VIXplosion (discussed HERE) and the uncertain weeks that followed, the “strong earnings” and the general lack of calamity has allowed US investor confidence to rebuild (even as bond investors panic as the US Treasury 10Yr yield has stuck above the 3.05% resistance level, increasing interest costs).
So with the company results in, and having been rather cynical about the misreporting of US profits in the past (by examining the facts -for instance HERE) perhaps it is time to revisit them and review this great strength by examining the industry standard Factset charts, published just last Friday:
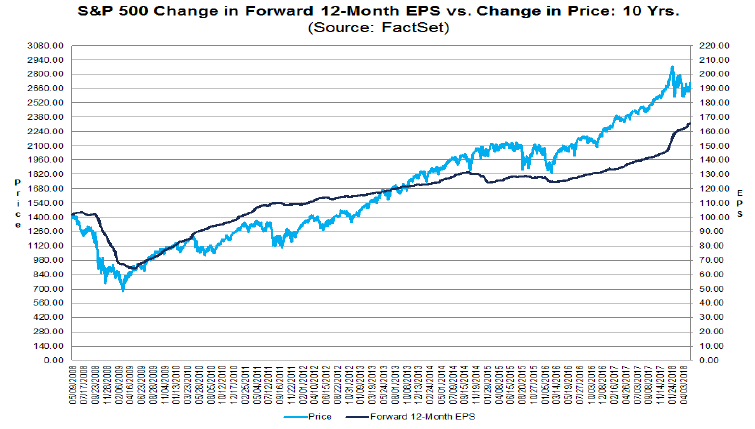
Source: Factset Click/Tap to Enlarge
As you can see, that dark blue earnings line keeps going up, approaching a magic $170 per share. But of course that’s the “Forward” or estimated (read “made up from guesses that fit the marketing departments requirements to sell product/services”).
So let’s look at the real, just reported, epic earnings:
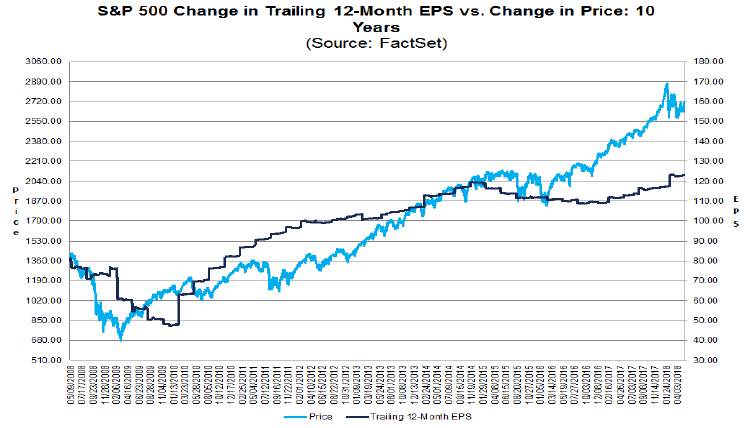
Source: Factset Click/Tap to Enlarge
Hmmmm……….So flat-lining at just over $120 per share, where they were at the start of the year. That’s disappointing.
Now while we would anticipate this to pick up a little as the quarterly figures role in over the year there are myriad factual reason to know that those believing the first chart is accurate would be wallowing in utter delusion (pure fact). This is unfortunate when the whole of Wall Street never turns the page (it is, literally and hilariously, just one page) of the Factset report to see the real figures.
But rather than rehash the reasons why this delusion persists, which we have covered often, perhaps we should look at pressing issues, such as how high investor margin debt remains in the US:
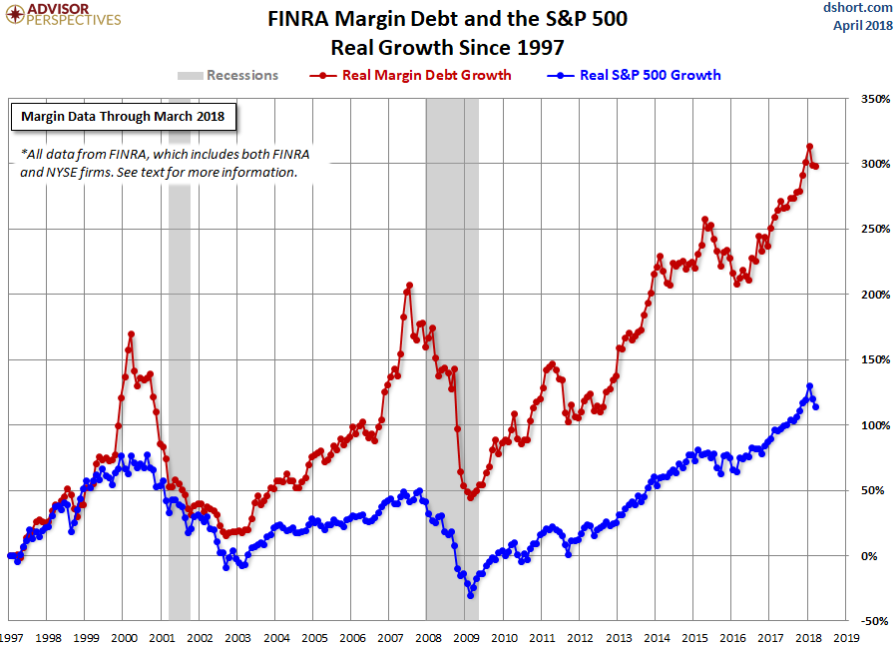
Source: dshort Advisor Persepctives Click/Tap to Enlarge
Remember margin debt allows investors to gear up, so lodging perhaps just 20% of the total investment with the broker. Hence $20K could be lodged to invest in $100k of shares and if these go up to $120k, and are then sold, the investor makes $20k profit; effectively doubling their money. However if the market falls by 15%, all of a sudden the investor has lost $15k, or 75% of the investment, so they may be forced to sell the full $85k of shares before potentially losing everything. This process exaggerates the exposure on both positive and negative markets and in a sell-off can drive panic liquidations.
Remember too that their is increasing levels of interest to pay on this margin debt as US rates slowly rise.
Now rates are still very low by historical standards but so high are debt levels let’s look at how household are impacted by the rate increases so far:
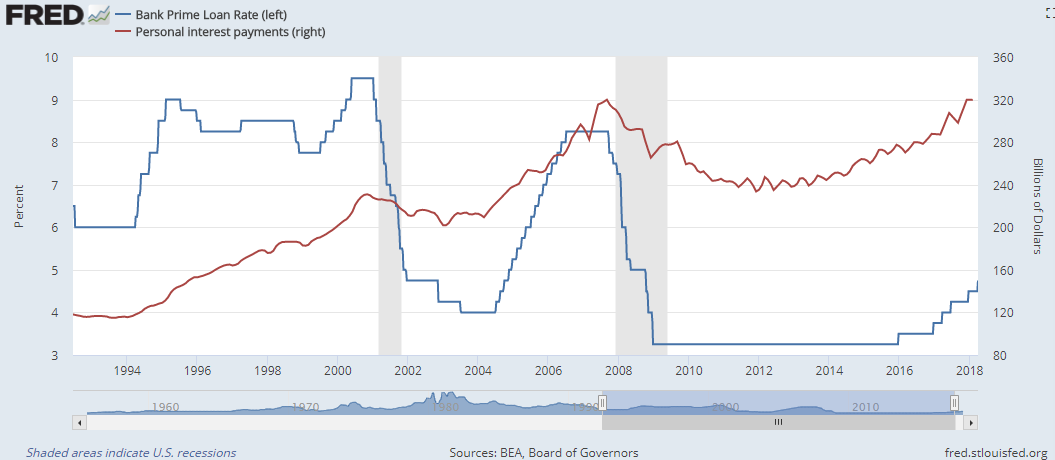
Source: St Louis Fed, AG Click/Tap to Enlarge
Thus you can see from the Red line the costs of servicing household debt has already increased to the point of pre-Global Financial Crisis/Credit Crunch levels, despite interest rates of around a third of that period.
Returning to S&P companies, they face a similar problem as this chart showing debt interest cover (the ease with which companies can cover their debt from earnings) over a couple of decades:

Source: SG Click/Tap to Enlarge
You can see that even the biggest stocks are down to interest cover levels equivalent to the GFC, while, despite rates still being historically low, while cover for the weakest half of the market is deteriorating.
But it gets worse if we look at a chart showing as a % of the S&P 1500 how many companies are having to borrow more just to keep paying interest on their existing borrowings:
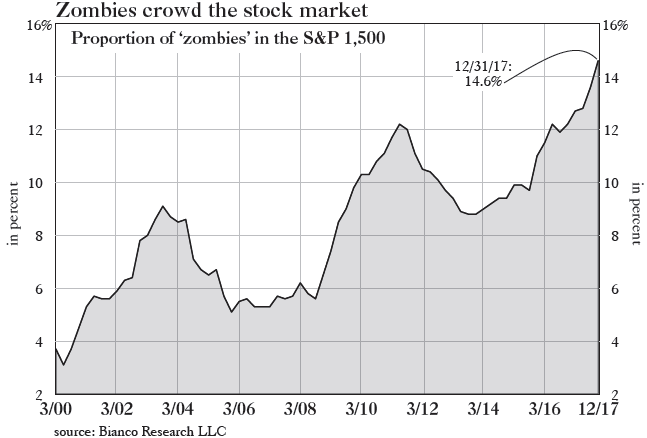
Source: Grants Interest Rate Observer Click/Tap to Enlarge
Record levels of (literally) ponzi financing with rates still very low….but, ominously, still climbing.
So far though with the demand for “safe” bonds (they have probably never been more dangerous, but that’s for another day) very high, bond defaults remain historically low….despite debt levels getting to record highs:

Source: Moody’s Click/Tap to Enlarge
Now the normal repost to a chart like this is that defaults are low because rates are low, which is of course why I put the other charts first….it doesn’t matter that rates are low as companies are struggling to pay debts anyway…. and God help them if rates keep rising.
No. The reason why defaults remain low is because in a bubble people keep buying assets based upon past performance and “common knowledge” rarely letting simple maths (or the lessons of history) get in the way. Thus problem companies keep refinancing to cover their liabilities, well at least until the music stops, as it always has done in the past.
But don’t worry company profits are rising strongly, as long as you don’t look at the actual numbers or compare that profit growth to debt growth:
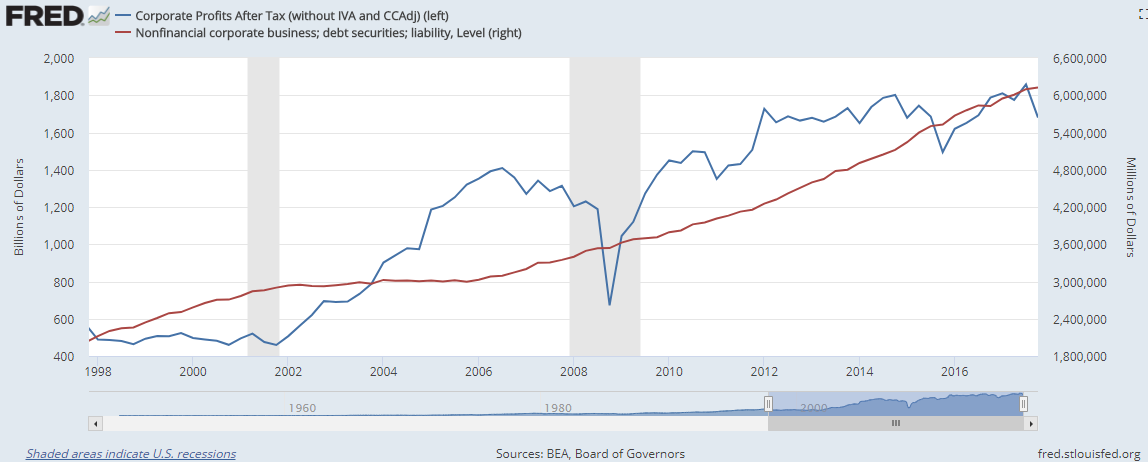
Source: St Louis Fed, AG Click/Tap to Enlarge
Yep definitely nothing to see here: move along, keep buying, move along…….