
In the UK we are building a lot less houses than we used to, an undeniable fact shown simply by the following chart from the UK Office of National Statistics (ONS):

Source: ONS Click/Tap to Enlarge
It’s so clear, so obvious what the problem is! We are building around 200,000 less homes a year than back when the Beatles and the Stones were where it was at.
No surprise then there is a crisis then and prices are so high, and as we can see below where they are now at record levels against average incomes, which are still below £30k, putting houses on around 8 times earnings, an all-time record high

Source: ONS Click/Tap to Enlarge
With so few houses being built the average household size must be getting uncomfortably large, with more and more children staying at home.
This is reflected in a chart showing how the average household has grown inexorably since the beginning of the 70’s

Source: ONS Click/Tap to Enlarge
Look! It’s so obvious, it’s so clear household sizes have increased with not enough housing available grown inexorably from more than 2.9 people per house, to a massive 2.35…………………………OH!
That’s less! That means houses have been built faster than households formed….for decades.
That can’t be right, that would mean all those news stories, politicians, bankers, estate agents and virtue-signalling do-gooders are wrong.
And here’s the stand out Pure Fact: They are wrong.
The reason we are building less homes now is that all that housing in the 1960’s/70’s was built for something like a post-war Baby Boom….you know that actually happened…which is why so many more houses were built, in a house building boom…..to cope with a population boom……which unsurprisingly simply hasn’t occurred since.
We think people would have noticed.
Worse the entire “shortage” narrative has been sold to all of us as the reason why houses are becoming so expensive, why already debt laden young need to laden themselves with even more debt and why investing in property is always a sure fire thing so they are willing, even desperate to do so.
And everyone buys it. The question is why when the evidence is clearly to the contrary?
Well the first answer is people with money want to believe in a story that makes them richer, hence in the US we see loads of stories on a stock market driven higher by rapidly rising corporate earnings, even though in reality they have only just recovered to levels seen in 2014. The lie supports the bubble wealth, the reality shows the bubble for what it is, so is ignored, dismissed, despised.
By looking at the facts we might find some answers and naturally see the story is nuanced and, as with all good con-jobs, there is a believable narrative based upon some serious housing issues which then provide a factual and emotive background to support a much larger, disingenuous truth. The first can be found in the first chart above, which is how back in the 1960’s-70’s a large proportion of housing was council housing, or as it would be described now social housing.
Thus there is a problem, particularly for those living in depressed regions or where house prices are insane, such as Greater London. However while a real issue and a convincing narrative hook it does not change the statistical reality, indeed, with sometimes large families crammed in small accommodation it probably biases the data for the larger private population where household sizes are probably smaller than they appear.
One key narrative support is the fact that since the GFC house building did in fact slowdown for a while before picking up again as these quarterly figures highlight:

Source: ONS Click/Tap to Enlarge
This fall in output is why the previous chart showed a small pick-up in average population size in the post GFC period, from 2.3 people in 2007 (the lowest household population since records began and also the zenith of a debt driven housing bubble based upon the last “housing shortage” narrative) per-household to 2.35 people per household (so an increase of just 2.2%). A relatively insignificant number but enough that it might be expected to provide a slight pick-up in prices in the early stages of “recovery”, although as the following price inflation chart shows there was actually very little increase in prices during the heart of this under-build period, before accelerating towards 10% p.a.
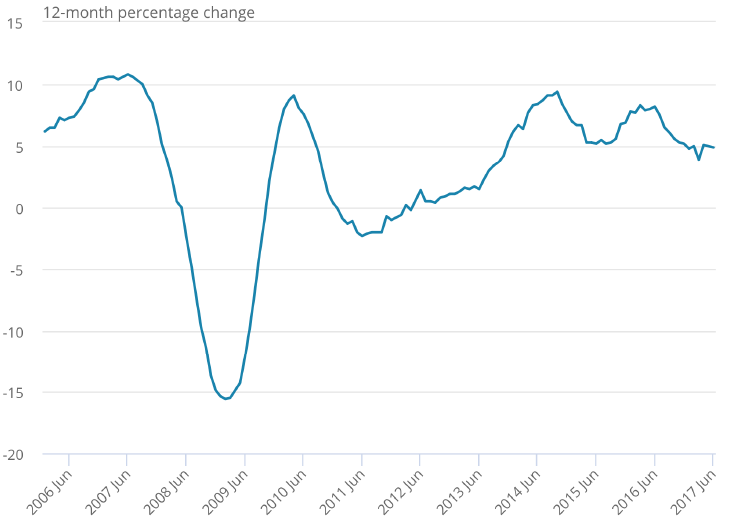
Source: ONS Click/Tap to Enlarge
Frankly this temporary reduction is supply, representing a tiny, tiny fraction of overall housing market turnover, shouldn’t have had a major impact and certainly with housebuilding ramping up to 160k units plus a year this is easily keeping up with, if not now exceeding, household formation as the government’s forced housebuilding exercise (relaxing planning rules based upon zero data both nationally or locally) has picked up steam (or was, now we here stories that house builders have began slowing the pace of development, if not land acquisition…….are they getting worried?)
Another key narrative hook though is more single people so more single person households, needing more houses. Certainly single person households did increase, from 6.6m in 1996, to 7.45m in 2007 and now 7.72m in 2017 (all ONS Data). However interestingly as a percentage of total households the number has varied, as in 1996 it represents 27.8% of 23.7m households, 2007 29% of 25.6m and in 2017 28% of 27.2m households.
Thus single person households are actually falling as a percentage of the total over the last decade, although this takes us to another narrative supporting story in that there has been an increase in adult children living with parents (a thesis supported by ONS data), so there would ideally be more single households and less multi person households if there were sufficient homes. However is this cause or effect?
You see it’s not just house prices that have gone up, average debt levels for the young have increased while real (inflation adjusted) earnings are, for many, falling and income security non-existent. Thus a fair proportion of this unfortunate cohort aren’t even in the market on the “real” demand side to push up prices as they have been so priced out of the market they are not even registering a demand. You simply don’t try to buy something you can’t afford.
In fact you could argue with a significant number of young effectively counted out of the statistics their absence should lower prices, pricing them back in. That’s how it’s supposed to work and thus should occur apart from a significant market distortion to the whole owner/occupier narrative: the housing equity stuffed landlord. Once successfully on the ladder, with growing property equity, landlords have been able to lever up with more and more debt, at ever lower rates, pushing prices up so gaining ever more equity and so on.
Which brings us to the next set of stats that throws sand in the face of the housing shortage argument, the fact that rents have not increase at anything like the rate of house prices, even as the demand for rented properties should necessarily increase if more and more are priced out of buying houses.

Source: ONS Click/Tap to Enlarge
You can see that across the country the annualised rate of rent increase has not exceeded 2.5%, while house prices increases have spent most of their time gaining more than 5% per annum, and it’s not just over the last 5 years if we first look at the South of England (where you can argue coherently on a local basis there is a degree of shortage, exacerbated by debt/asset bubble dynamics focused on London, although again the increase in rent is by several orders of magnitude less than house prices):

Source: ONS Click/Tap to Enlarge
Notably in the North you could argue that inflation adjusted rents have fallen:

Source: ONS Click/Tap to Enlarge
These are not the statistics of a desperate housing shortage, but more of the landlords housing equity/debt gearing bubble, creating a self-reinforcing debt fuelled artificial market. Investors can buy properties using equity in the portfolios to gear up at low rates, thus enabling a profit on rent even though this has hardly budged against the underlying asset value, which in the meantime provides a paper profit, enabling more housing equity and more ability to gear up for the investor.
Debt bubble dynamics at their very best/worst. Thus the entire value of this process depends upon the debt fuelled asset inflation being supported by perpetually low rates, which nonetheless drives excess investor demand pushing out into a larger market, propagating false narratives of shortage, encouraging herd like behaviour and the concurrent all pervasive justifying narrative.
(As an aside one of the few intelligent housing policies in recent years have been efforts to curb this Buy-to-Let bubble, although after a brief interlude such has been the positive mood music investors are now willingly absorbing the extra costs as house will always go up……coz there’s a shortage. Right?)
Unfortunately the data clearly doesn’t indicate any sign of a housing shortage on a national basis. In fact it is clear that the evidence not only doesn’t support the housing shortage narrative, in large part it directly refutes it.
(As an aside the only coherent way the housing shortage narrative works when the stats show there really, really isn’t one is a Want/Greed Bubble, where those who have money/equity/access to finance WANT another house, a holiday home, and investment property etc. In fact want so many properties wanted the average household size could fall to 0.8 and there’d still be shortage. In this Want/Greed Narrative there is always a shortage as we want more and more of what we don’t need…..However this is a very unattractive reflection on the human condition so lets ignore it for the moment)
More to the point should the debt/bubble narrative fail, either through recovery and rising rates, recession and falling demand, or a financial crisis there is not fundamental support for housing other than debt and housing could crash again once the clear fiction is seen for what it is.
And yes remember the lesson from the GFC house prices can easily fall and, if you look at the Northern Ireland price line of the following graph, they really can crash and stay crashed (prices still around 40% below peak, similar falls occurred in parts of London and fashionable parts of the South East in the early 1990’s and took a decade or more to recover):

Source: ONS Click/Tap to Enlarge
In the not too distant future we will delve into the bubble psychologies that, in one way or another, are behind the MOAB (Mother Of All Bubbles) showing that as a society we have learnt nothing from the GFC, which itself followed a much smaller (no really….a MUCH, MUCH smaller) bubble, bursting just a decade ago and demonstrate why (dipping into the latest behavioural insights from psychology) basic facts seem increasingly ignored and marginalised in an increasingly disturbing collective delusion.