
In the previous post we examined how stock market behaviour had changed for the negative in 2018, despite literally incredible sums of money being thrown at elevating share prices regardless as company management has tried to boost share prices and, by extension, their own remuneration.
However as the gap between expensive fictions and basic maths has grown so large it is worthwhile taking a sober look at the size of this disconnect, which in turn might help inform how much of a correction might be upon us as the S&P has rallied further and further away from economic reality.
This is graphically obvious in the chart below where you can see the stock market diverging away from historic recovery trends with growing rapidity:

Click/Tap to Enlarge
In itself this is striking but we add colour by comparing the growing divergence between asset prices, represented by US Household Net Worth figures, and underlying US growth on a long-term basis:
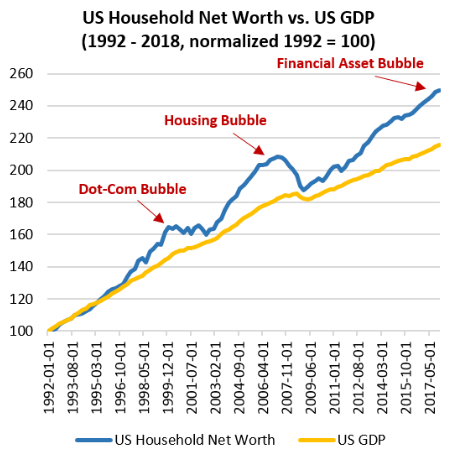
Click/Tap to Enlarge
Of course a stock market fueled by companies spending vast sums, cannibalising themselves through buybacks, to present a palpably false story (that is swallowed hook, line & sinker by the vested interest financial press) is likely to be distorted, but by how much?
A sobering way to appreciate what is going on can be seen in the next chart below, where the grey line moving from left upward from left to right shows the impact on earnings per share via share buybacks, accelerating following the recent tax cuts and also the shares outstanding falling from left to right as this takes place:

Click/Tap to Enlarge
Perhaps more interestingly on this chart is the breakdown of how earnings per share have increased by 353% since the bottom of the bear market in 2009, while top line sales have only grown 44% in a nine-year period (or around 4% p.a.) from a near depression levels in 2009.
The term ‘cognitive dissonance’ could have been coined for the stock markets over this last decade but by adding a little more specific detail we can highlight just how absurd things have become by looking at individual companies, which we will do in the next post.