
One of the pleasant surprises of the debt dependent (faux) global recovery has been that the UK economy has consistently been at the top of the charts for growth among our developed world peers, even if the figures remain meager by the standards of previous recoveries. Furthermore, although we know that this has been bought on the back of unsustainable trade and, more importantly, government deficits (so much for austerity) this is not a unique situation and has certainly been more constructive than suffering the extended depressions of the austerity Eurozone states.
One of the particular “successes” of government policy has been the falling rate of unemployment, a necessary outcome from an economy highly dependent upon consumers (a basic economic fact that passes many by, especially Germans) and on a basic level this is reflected in a 10 year chart:

Source: Trading Economics Click/Tap to Enlarge
Now as we will see this flatters to deceive but at least by comparison the aggregate Eurozone figure looks very poor:

Source: Trading Economics Click/Tap to Enlarge
While looking at a specific friend, Italy (after all we championed Garibaldi in creating a unified nation) the story looks very sad with even less of a jobs recovery than elsewhere, partly through imposed depression and partly due to a ludicrous lack of flexibility and entrenched vested interests within the labour market (against which the Germans rightly rail):

Source: Trading Economics Click/Tap to Enlarge
And to be fair to the toffs at the top, despite the UK running large deficits let’s compare the growth of government debt to austerity Europe, first looking at the UK:
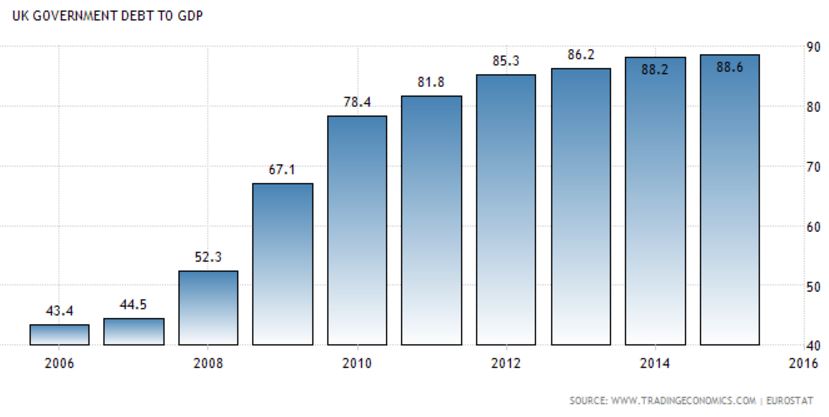
Source: Trading Economics Click/Tap to Enlarge
Looks dreadful doesn’t it? In adjusted terms surviving the banking crisis has cost more than most major wars, and while the current government was not in power when things broke down, when in opposition no-one other than Liberal Vince Cable was prepared to stand up and point at the building stupidity, a job the main opposition should normally do.
Moving to Europe we see a similar picture:

Source: Trading Economics Click/Tap to Enlarge
While EZ debt may have started from a higher point it remains higher still, pointing to the “success” of austerity policies as structural unemployment will remain a drag for years, if not decades to come.
However returning to the UK average wages have been rising only slowly at around 1.5% per annum, about half the pre-crisis rate. More troublingly is that in real, inflation adjusted terms they have in practice been falling, as this Office of National Statistics (ONS) clearly demonstrates:

Source: ONS Click/Tap to Enlarge
Remember too that this is based upon official inflation statistics, which have been somewhat lower than those experienced by real people for most of the period.
This is the rub. If we are growing so well and employment has picked up so much, then why are most people poorer in real terms? Now there should be no real surprise about this reality for people working outside of City ivory towers, where they think the world is doing just fine as long as their bonuses are great (I’m not kidding…..it’s not just an I’m alright jack attitude, many I meet are just too myopic to see outside of the cloistered world of finance and appreciate what its like for ordinary people).
These effective wage falls have, of course, had a massive knock on to a consumer economy and helps explain why growth has remained so slow.
However the most important detail is found in the chart below, which clearly points to the heart of the problem. The important bars to look for are the green ones representing full time employment:
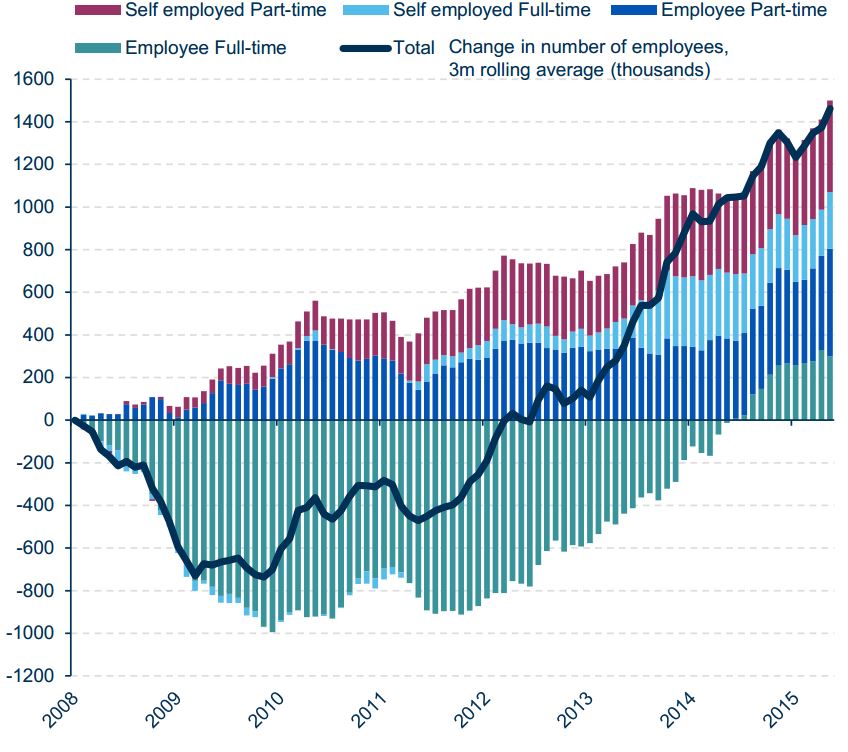
Source: Standard Life Click/Tap to Enlarge
You can see how in the immediate aftermath of the crisis full time employed positions fell sharply, leading the overall rate of change downwards. Slowly however other jobs appeared, first part time work (blue) then slowly part time self employed (red) and eventually full time self-employment; however it was only in 2014 that full time work began to pick up and remains well below 2008 levels.
Now bearing in mind many part timers will probably wish they were full timers and may be working (and living insecurely) on zero hour contracts and that many of the self employed will effectively be contract workers in a similar situation we can see both why wages and consumption and hence growth haven’t flown upwards. Meanwhile the plethora of part time jobs and low paying self employed roles will also necessarily reduce the tax take that powers the state, one of the few employers that hasn’t cut staffing to the bone (and despite junior doctors angst it really, really hasn’t).
However despite how this demonstrates that the government produced headlines are at best disingenuous and all about smoke and mirrors……actually lets be straight they represent outright government BS……at least we can see here the flexibility of the UK labour market, which in light of the problems coming down the pipe this is a GOOD THING.
Indeed with the response to the next crisis likely to be hysterical fiscal money printing into the real economy the UK is among the best placed to cope, with the need for massive infrastructure investment and a flexible and adaptable labour force, which may well absorb the inflation pressures resulting for longer than many countries.
However as a footnote and before we get too comfortable about UK PLC (one of the few areas Prometheus has been generally cheerful about…not valuations mind, just the underlying companies) let’s look at the disturbing revelation from the SocGen Equity Quant Team (who we discussed briefly in our examination of share -over-valuations HERE), who have highlighted how much debt UK companies have taken on since the GFC, a revelation that shocked even a very bearish Prometheus:

Source: SG Click/Tap to Enlarge
Put simply UK PLC’s balance sheet isn’t as healthy as we thought and with bank balance sheets clearly far weaker than they are pretending (see the post about BHS HERE for some of the reasons why) this presents us with a situation that is less than optimum.
Now that we are sure the light at the end of the tunnel is in fact an oncoming train the only question that remains is how fast it’s going and can we dodge it, however we would be happier if debt levels were lower across the economy. While it does not necessarily mean catastrophe it clearly points to continuing overvaluation within the equity markets and caution remains key.