
That share prices have long been disconnected from normal measures of value is not news for regular readers, or frankly any experienced, financially literate stock market watcher, although we still await the time the self-evident facts will finally embarrass those who believe in “evidence based investing”, “efficient market hypothesis” , “Modern Portfolio Theory” or “scientific investing” into admitting that they are clueless about how markets actually work*.
SG’s terrific Andrew Lapthorne has been pointing out for a while, backed by volumes of quant based research, how absurd things have become and now, finally, as the Bull slowly dies, Goldman’s suddenly feel they can point out the obvious too. But first let’s have a quick look at some of Andrew’s charts from the SG conference in January (which we still hope to cover soon in more detail, time permitting), starting with how expensive the US market has become on two separate measures, traditional PER and the less well known EV to EBITDA:

Source: SocGen Click/Tap to Enlarge
(Note: EV = Enterprise Value, or basically the value of the listed company + the value of the debt…..hence reflecting the real cost to any outright buyer who would have to take on debt obligations. EBITDA = Earnings Before Interest, Tax, Depreciation and Amortisation ….simply top line turnover, less fixed and operational cost before clever accountancy gets involved. Hence a no nonsense value of the company divided by no nonsense measure of earnings.)
But the problem is not just in the US:

Source: SocGen Click/Tap to Enlarge
This is hardly news when looking at the evidence we have demonstrated in previous posts (for instance HERE and HERE).
One of the more troubling aspects of the recent bull market however has been the build-up of debt, largely taken on to enable equity to be bought back at ever higher levels, enhancing earnings per share (by reducing the shares in issue) to stimulate share prices (upon which Board Room remuneration is largely set – can’t imagine there’s a link), even as earnings have begun to tail off.

Source: SocGen Click/Tap to Enlarge
Now while this debt is cheap to service at the moment such a build up is based upon the (depressingly widespread) common fallacy that debt is cheap in a low inflation/low interest rate world, (which is of course the opposite of the mathematical truth, particularly for longer term debt, as we discuss with reference to the type of debt we are most familiar with, specifically mortgages, HERE) and as such is very troubling.
More to the point this debt has to be refinanced and if this occurs in a much higher interest rate environment (after all a 4% US Base rate is 8 times higher than the top of the current interest rate range!) which is totally conceivable without inflation lifting enough to really erode the value of the debt, then a lot of companies are in trouble:

Source: ScoGen Click/Tap to Enlarge
All very troubling, but as Andrew Lapthorne works closely with uber Bear, Albert Edwards (compared to whom Prometheus is often a deluded Panglossian) some will not pay the attention they should.
Put simply this is data analysis, not opinion. Attention should be paid.
However some cognitive biases are hard to shake so when Goldman Sachs goes “Errr……hang on a mo’…” we really should listen and pass on the message, as ZeroHedge did with surprisingly restrained happiness (HERE).
One of the key issues we have with much analysis of equity values over recent years has been the constant, unquestioned quoting of “Forward PE Ratios”, often based upon earnings estimates (otherwise known as guesses….which as we shall soon see below are largely VERY uneducated) as far as three years out, rather than the more reliable (although still requiring ever greater levels of scrutiny) LTM PER, or Last Twelve Months Price Earnings Ratio.
You see if you believe in a magic future you can make a Biotech stock sound sensible if, for instance it trades a Forward PER of 19, cheap for its growth prospects….missing out the bit that this is an estimate for 2018 earnings and that right now it loses $400m a year……..BTW this is NOT exaggerating, we see stuff like that all the time!
Unfortunately the reality is that forward earnings are, almost without fail, downgraded steadily as each actual earnings release is reached, showing just how absurd the practice is, particularly when an earnings recession actually occurs and figures fall, like the one in the US now (No really! Not heard that its one of the most disappointing earnings reporting seasons for years? Strange isn’t it? Wonder if the financial media have a vested interest in keeping you feeling bullish?).
Amusingly the practice of Forward ratios is so meaningless that it is normal for the figures to be slashed even further just prior to the actual data release, below what the company has secretly whispered….allegedly…. will actually be the final figure so the media can talk excitedly of “Earnings Beats”.
We’re not making this stuff up, but the easiest thing to do is look at the following Goldman chart on how forward estimates fair through time:
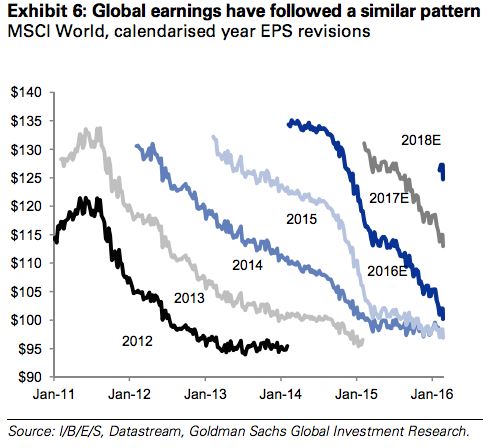
Source: ZeroHedge, Goldman Sachs Click/Tap to Enlarge
This chart is clear on two key points, the first being that you should never trust guessed forward earnings, while secondly we see actual earnings haven’t actually gone anywhere fast.
Looking more specifically at the “conservative” Eurozone the results are the same:

Source: ZeroHedge, Goldman Sachs Click/Tap to Enlarge
While the next chart shows how much of the recent gains in European markets has been driven by multiple expansion (rising PERs) rather than rising actual earnings:

Source: ZeroHedge, Goldman Sachs Click/Tap to Enlarge
This ties in with one of our favourite JPM charts comparing the European markets with European earnings:
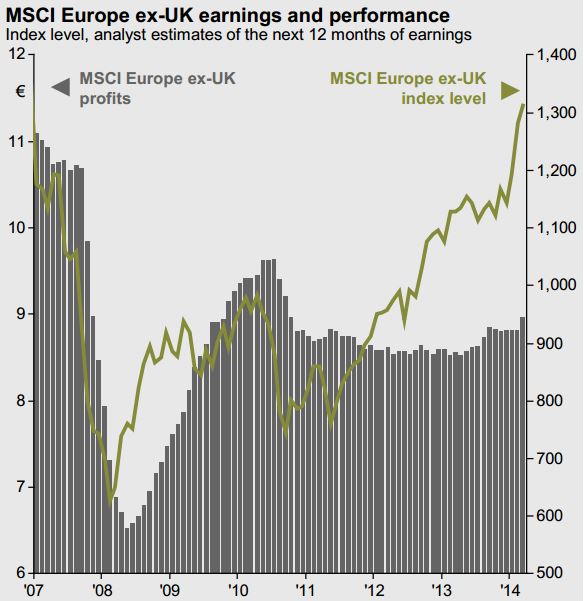
Source: JPMorgan Click/Tap to Enlarge
More to the point for those bargain hunting at current levels Goldman’s show that valuations have not fallen to levels comparable to previous “cheap” market trough opportunities; indeed anything but (although we are highly amused by their use of “forward” earnings without a hint of irony!):
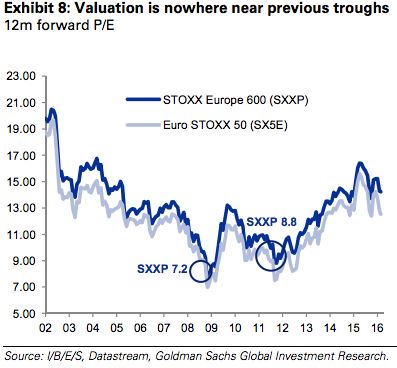
Source: ZeroHedge, Goldman Sachs Click/Tap to Enlarge
Against a background of feeble growth, where deluded Central Bankers talk of Negative Interest Rate Policy (NIRP) like it’s a rational concept and the US has increasingly been throwing out worrying data points, then investors really should look at their equity exposure with care.
That said doesn’t mean the G20 can’t produce some positive surprise this weekend….or negative. However we would suggest; focus on the fundamentals and they tell you to remain very cautious with your equity exposure and if you are utilising fund managers choose descent “bottom -up” investors who focus on long term value and give tracking funds the wide berth they deserve.
*(The evidence against “evidence base”, “scientific” and “MPT” investing is so profoundly obvious that shame on all those who will “advise” and “manage” client funds using these concepts when by utilising them they, almost by definition, demonstrate they understand virtually nothing about markets or, most especially, the maths behind their beloved snake oil – which frankly most in the investment industry have never been trained in…………..Hint for the uninitiated, from someone who is trained, qualified and depressingly market wizened: It’s scary looking mathematical nonsense that posits the future will equal the recent past….. Oh and that people are highly rational….To which we ask: “And your evidence through history for these beliefs are???”…..The very fact that rational adults can believe such a self evidently irrational concept, which depends upon well understood cognitive illusions, largely so they can avoid having to think and learn while leaning on the reputations of Noble Laureates, who they don’t appear to know nearly destroyed the financial system at LTCM in 98, should be enough for anyone to dismiss them. If in doubt read more thorough dissections HERE and HERE)